These are a collection of projects where I was the editor behind them. My involvement in them consists in conceptualizing and giving guidance to the graphics reporters working on these pieces.
As editor, I am the liason between the graphics reporters and the text reporters and editors in the various sections of the newsroom. I assist the graphics reporters and find solutions looking for the best way to tell the story. We brainstorm, research, develop and produce the ideas together on tight deadlines.
Stories I have covered include the Ukraine War, Israel-Hamas conflict, the Turkey earthquake, the fall of the Assad regyme in Syria, China’s geopolitics, the Titan submersible and more.

“See How Russia Is Winning the Race to Dominate the Arctic” - analysis of the Arctic race by the world’s powers
Graphics by Daniel Kiss and Roque Ruiz
Words by Thomas Grove, Vipal Monga and Austin Ramzy
Graphics by Daniel Kiss and Roque Ruiz
Words by Thomas Grove, Vipal Monga and Austin Ramzy
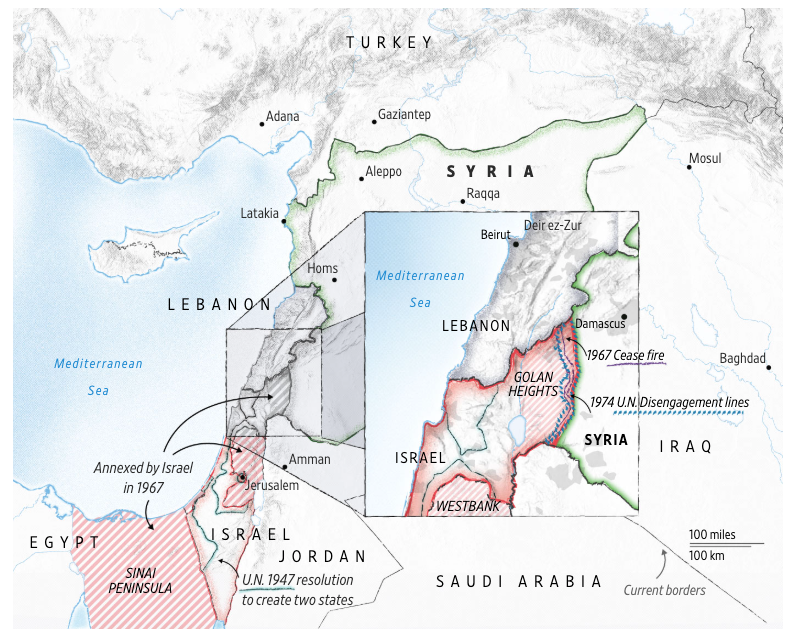
Live page: https://www.wsj.com/world/middle-east/a-visual-guide-to-syrias-long-struggle-for-freedom-bfd151ba
“A Visual Guide to Syria’s Long Struggle for Freedom” - the history behind the country
Graphics by Camille Bressange
Words by Michael Amon and Camille Bressange
Research by Roque Ruiz
Graphics by Camille Bressange
Words by Michael Amon and Camille Bressange
Research by Roque Ruiz

“See How Russia Is Winning the Race to Dominate the Arctic” - analysis of the Arctic race by the world’s powers
Graphics by Daniel Kiss and Roque Ruiz
Words by Thomas Grove, Vipal Monga and Austin Ramzy
Graphics by Daniel Kiss and Roque Ruiz
Words by Thomas Grove, Vipal Monga and Austin Ramzy
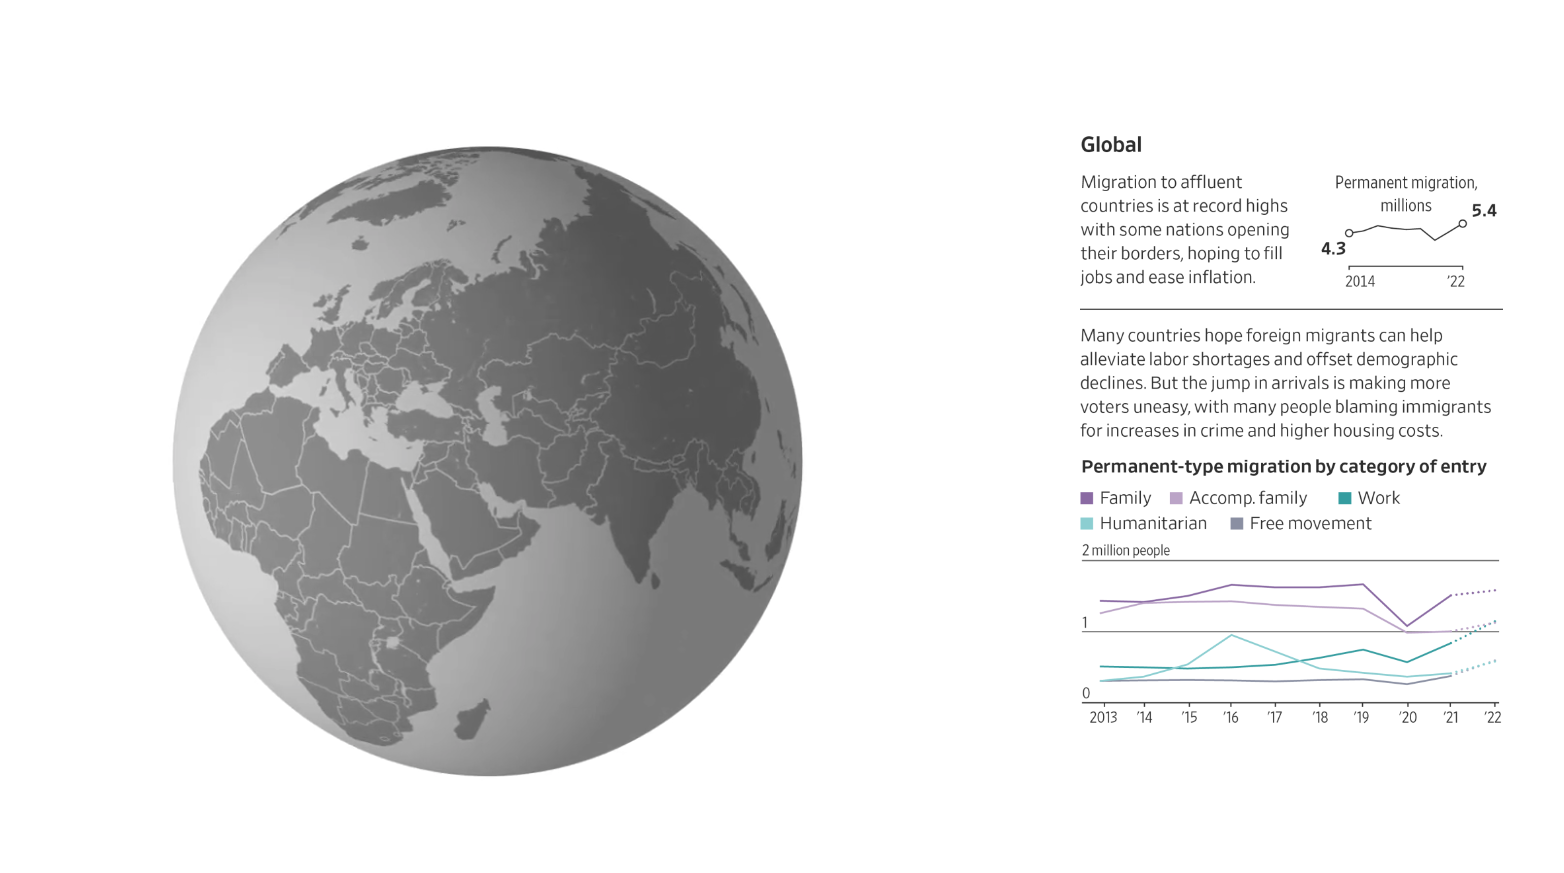
“The World is on the Move” - explainer of the latest immigration trends around the world.
Graphics by Rosie Ettenheim
Motion graphics by Peter Champelli
Words by Tom Fairless
2024 New York Press Club Winner
Graphics by Rosie Ettenheim
Motion graphics by Peter Champelli
Words by Tom Fairless
2024 New York Press Club Winner

“Drones are Changing How Wars are Fought” - in this story we explain how uncrewed vehicles make combat faster, cheaper and smarter showing different scenerios with animations.
Story by Daniel Michaels and Stephen Kalin
Coding by Juanje Gómez
Graphics by Jemal Brinson
Story by Daniel Michaels and Stephen Kalin
Coding by Juanje Gómez
Graphics by Jemal Brinson
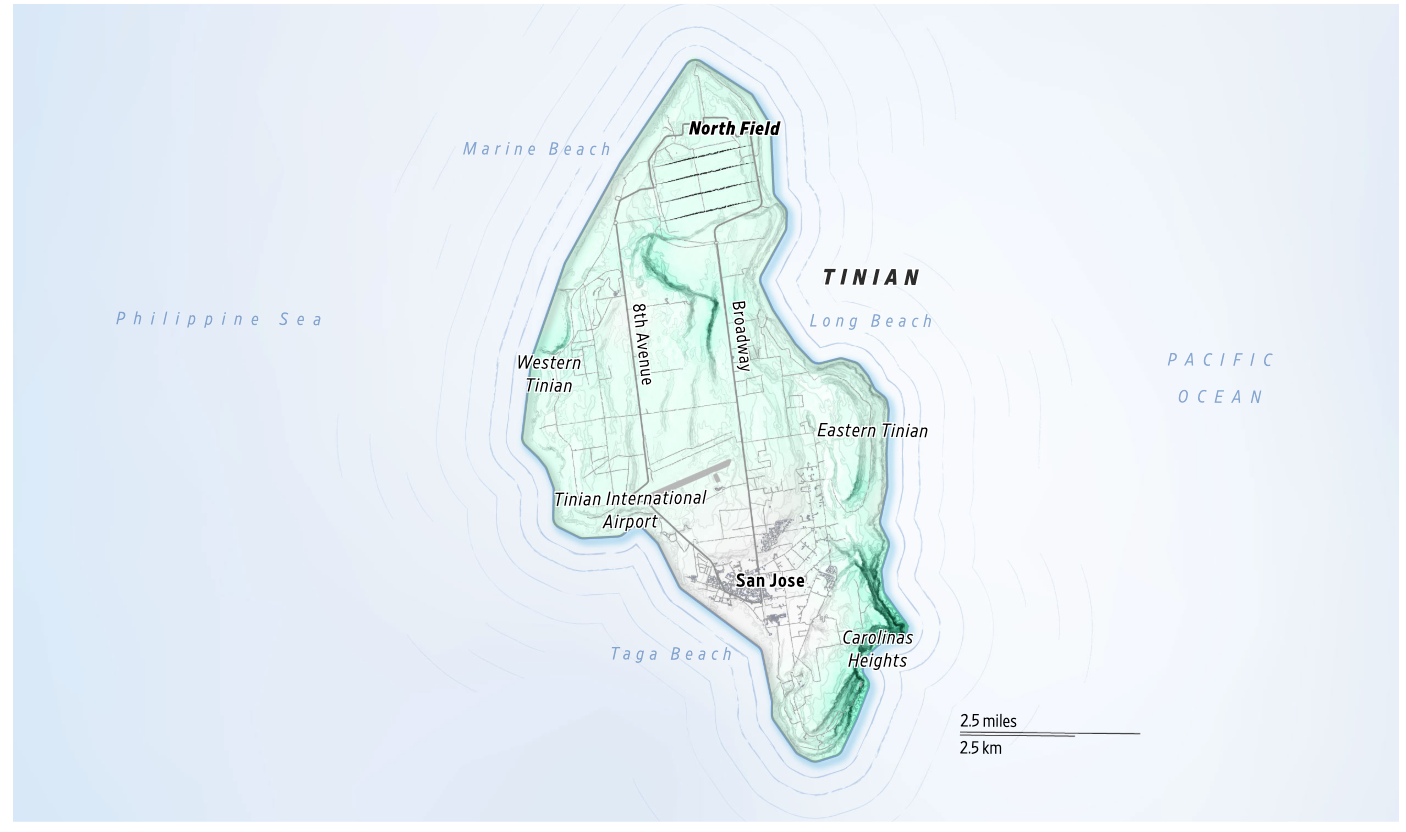
“Scatter and Survive: Inside a U.S. Military Shift to Deny China ‘Big, Juicy’ Targets” - a close look at U.S. refitting of the Tinian airbase in the Pacific
Story by Niharika Mandhana and Mike Cherney
Graphics by Camille Bressange
Story by Niharika Mandhana and Mike Cherney
Graphics by Camille Bressange
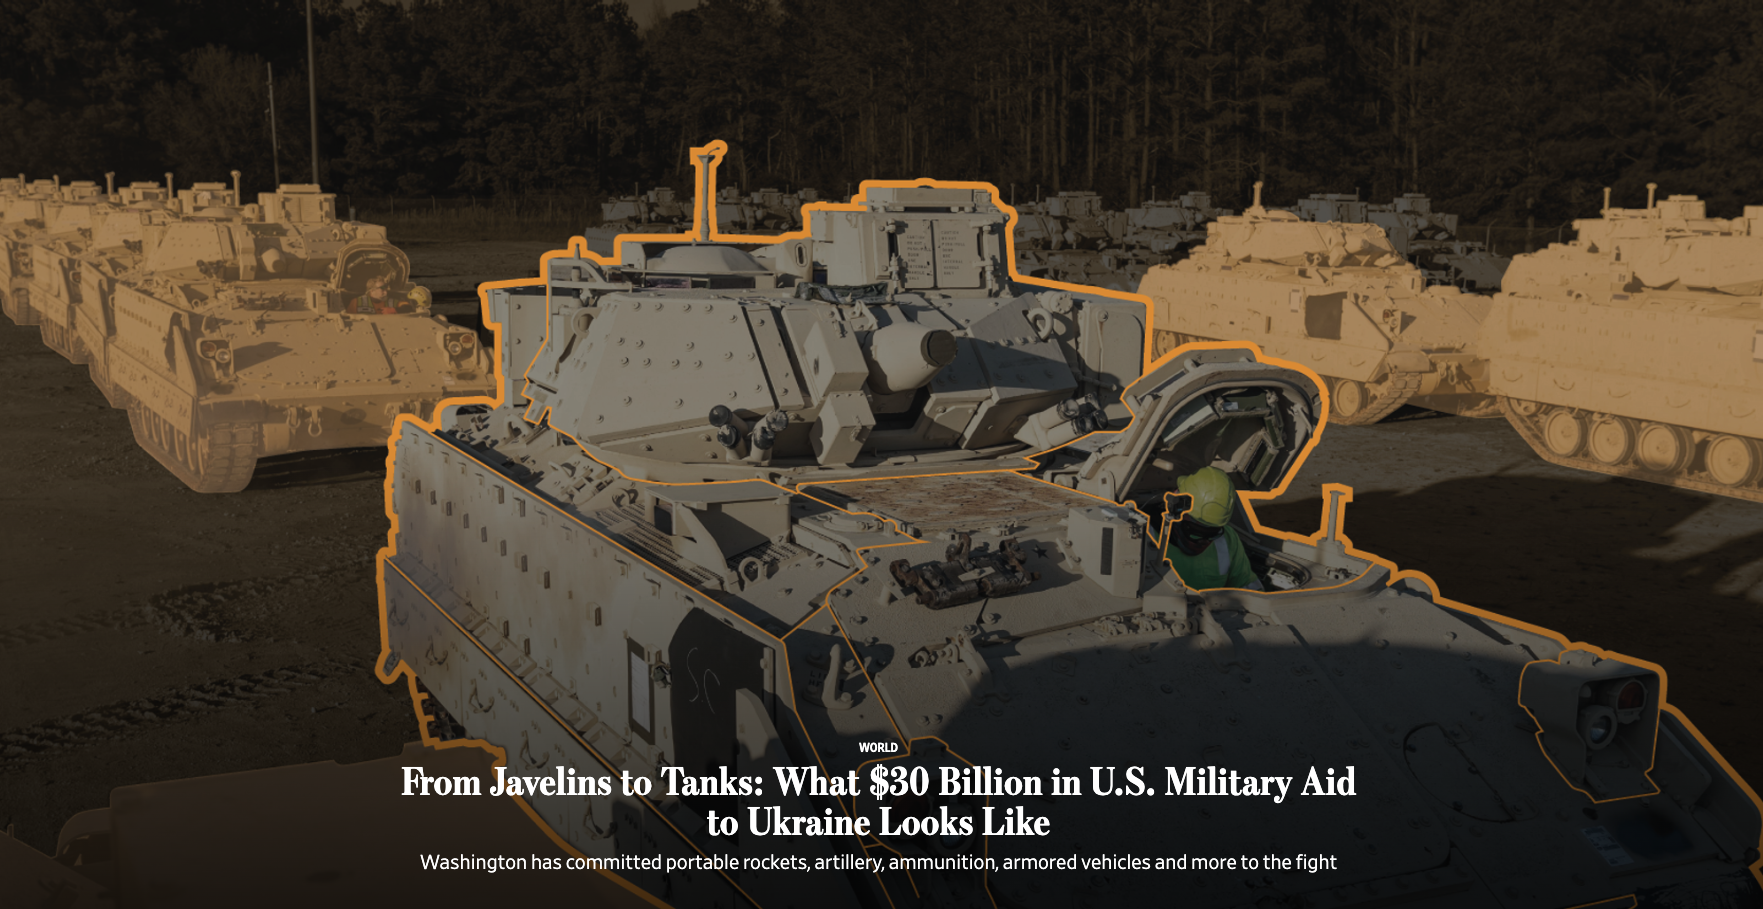
Live page: https://www.wsj.com/articles/how-u-s-weapons-play-a-growing-role-in-the-ukraine-war-8ee548ef
Story about the different types of weapons the U.S. provided to Ukraine. A chronology showing when these weapons were authorized and the amount in dollars of security assistance by the U.S.
Video work by Peter Champelli
Coding by Juanje Gómez
Reporting by Daniel Nasaw
Video work by Peter Champelli
Coding by Juanje Gómez
Reporting by Daniel Nasaw

“I Said Yes to Every Upgrade in Las Vegas. Here’s What it Cost” - we contributed a cost tally to this fun story by WSJ travel columnist.
Story by Dawn Gilbertson
Coding by Jason French
Illustration by Elizaveta Galkina
Story by Dawn Gilbertson
Coding by Jason French
Illustration by Elizaveta Galkina

Interactive map with audio snippets transporting the reader to different locations in the Gaza Strip.
Coding by Juanje Gómez
Maps by Camille Bressange
Audio by Luke Vargas
Reporting by Chao Deng and Stephen Kalin
2024 SND Award of Excellence
Coding by Juanje Gómez
Maps by Camille Bressange
Audio by Luke Vargas
Reporting by Chao Deng and Stephen Kalin
2024 SND Award of Excellence
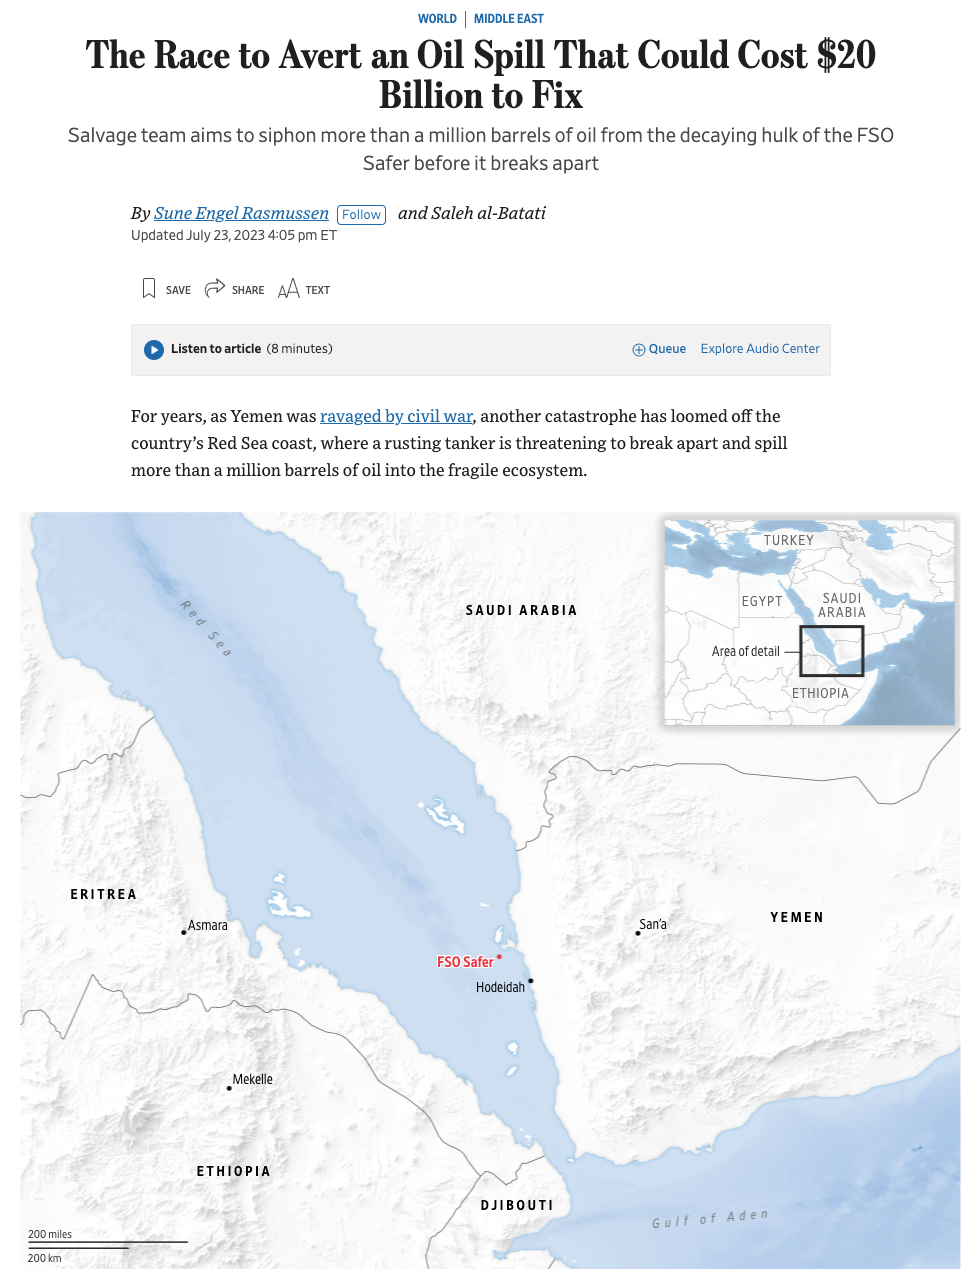
Live page: https://www.wsj.com/articles/the-race-to-avert-an-oil-spill-that-could-cost-20-billion-to-fix-85a884ea
Contributed to this text story by Sune Rasmussen a parallax package of maps showing the location of the FSO Safer, the protected areas in the Red Sea, surface oil concentrations scenarios and desalination plants, as well as a diagram of how the transfer of oil would work.
Maps by Jake Steinberg
Diagram by Kevin Hand
Maps by Jake Steinberg
Diagram by Kevin Hand
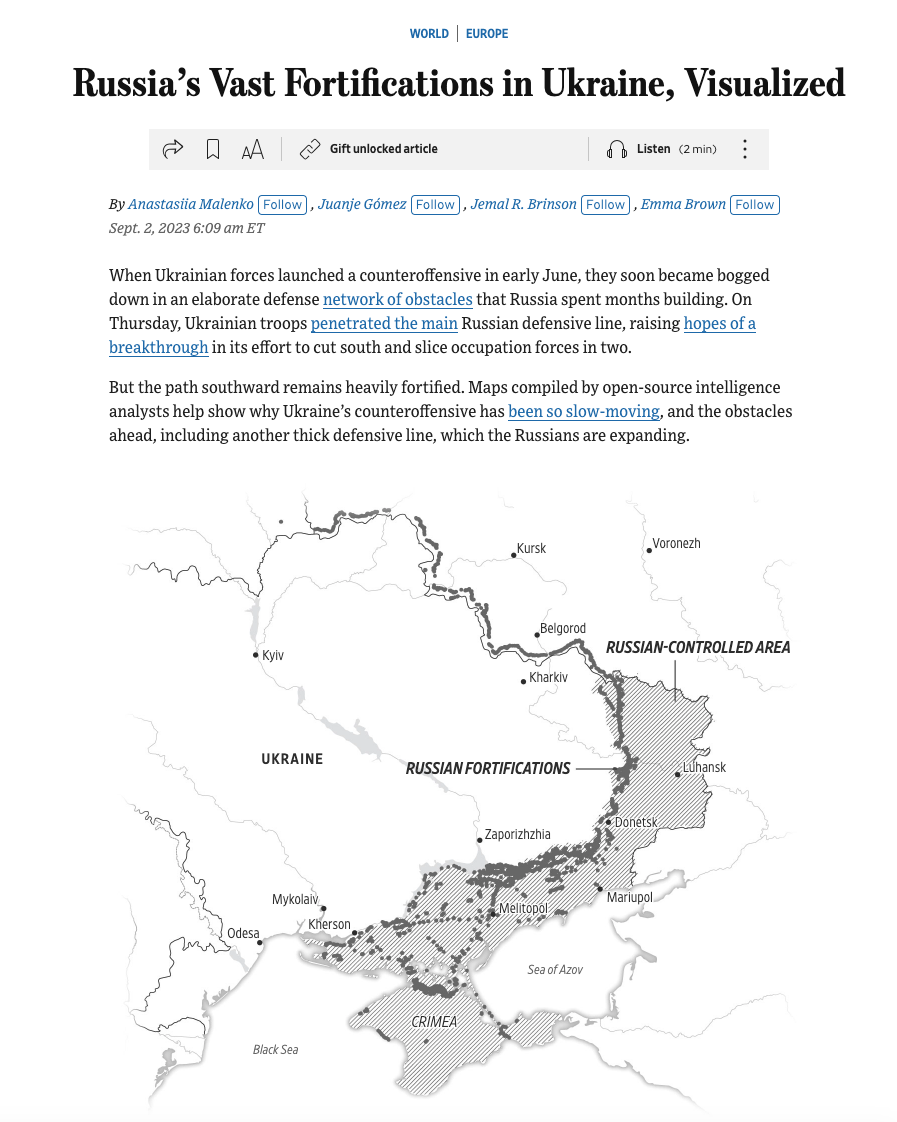
Live page:https://www.wsj.com/world/europe/russia-defense-ukraine-trenches-dragon-teeth-visualized-614a4910
We mapped the Russian fortifications (including trenches, foxholes, dragon’s teeth), explained what dragon’s teeth are and produced a scrolly piece analyzing the different types and layers of fortifications Russian has build to defend several towns including Tokmak, a logistics hub.
Production by Juanje Gómez
Map by Emma Brown
Diagram by Jemal R. Brinson
Production by Juanje Gómez
Map by Emma Brown
Diagram by Jemal R. Brinson

A charticle, showing different metrics, on how retirement will look like for Americans.
Story by Veronica Dagher and Anne Tergesen
Story by Veronica Dagher and Anne Tergesen

Live page: https://www.wsj.com/world/europe/a-look-at-the-u-s-missiles-ukraine-seeks-to-hit-russian-forces-c12419da
Explainer graphic standalone on ATACMS missile system.
Diagrams by Jemal R. Brinson
Map by Emma Brown
Diagrams by Jemal R. Brinson
Map by Emma Brown
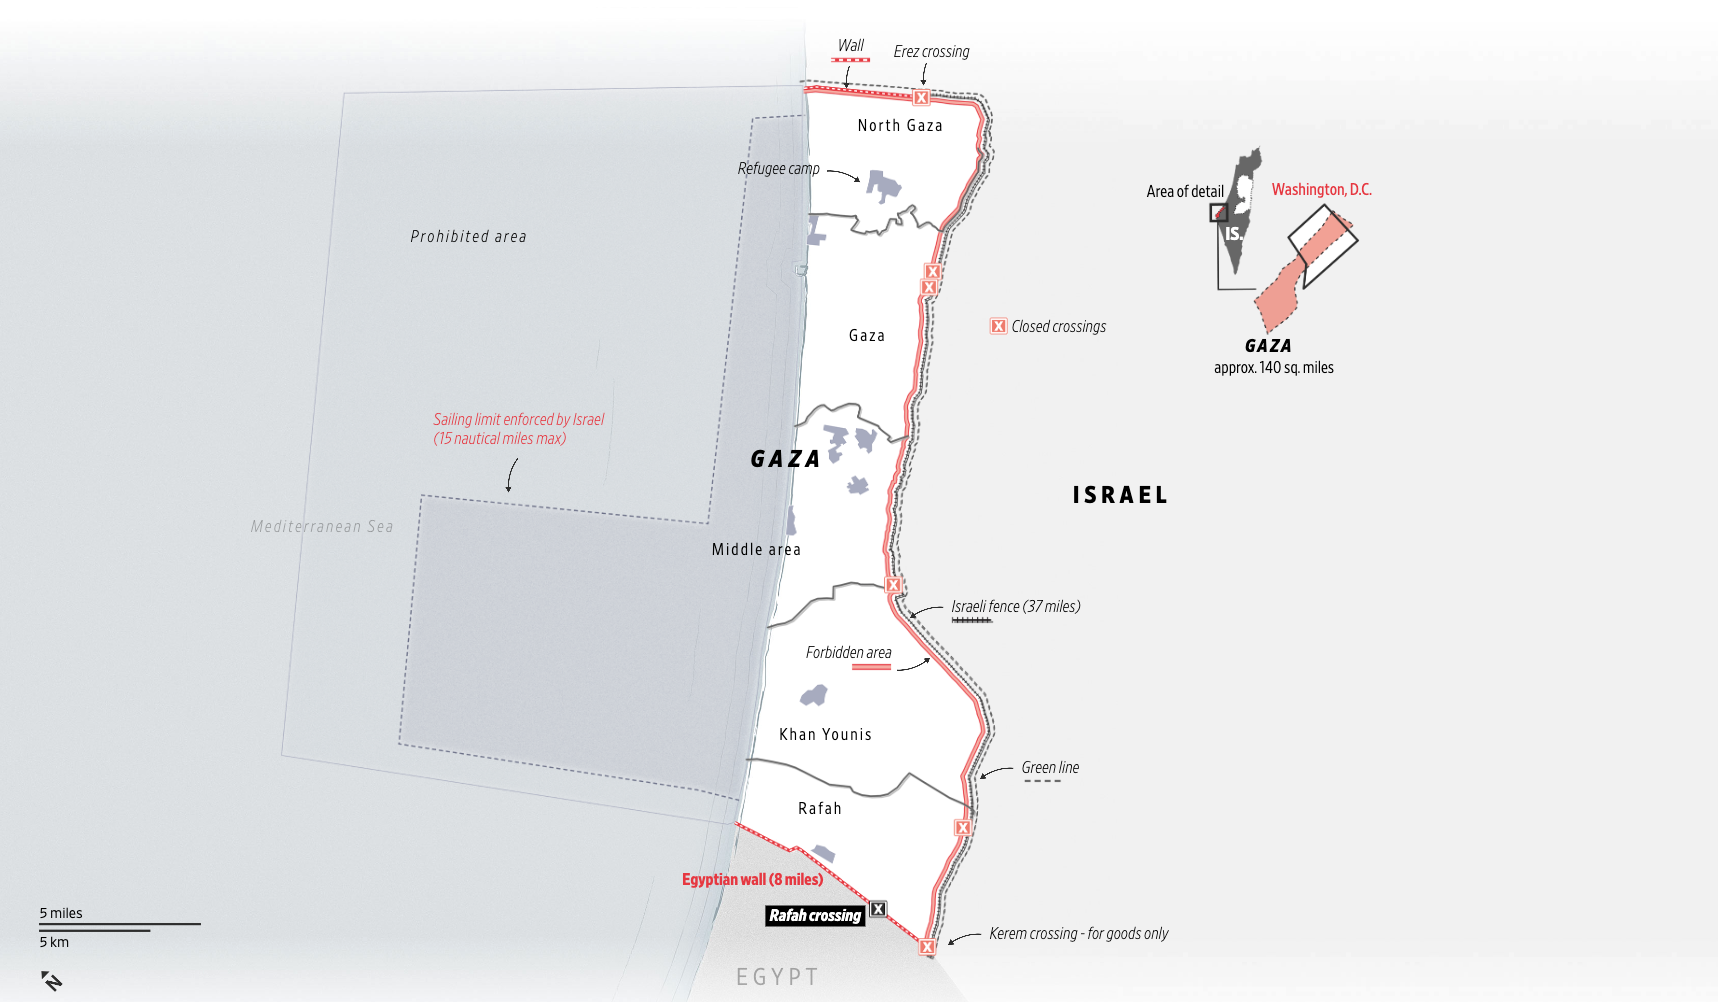
Live page: https://www.wsj.com/world/middle-east/israels-military-strategy-in-the-gaza-strip-mapped-e9186fef
Collection of maps explaining the military strategy Israel is taking in Gaza to oust Hamas.
Maps by Camille Bressange
Coding by Juanje Gómez
Maps by Camille Bressange
Coding by Juanje Gómez
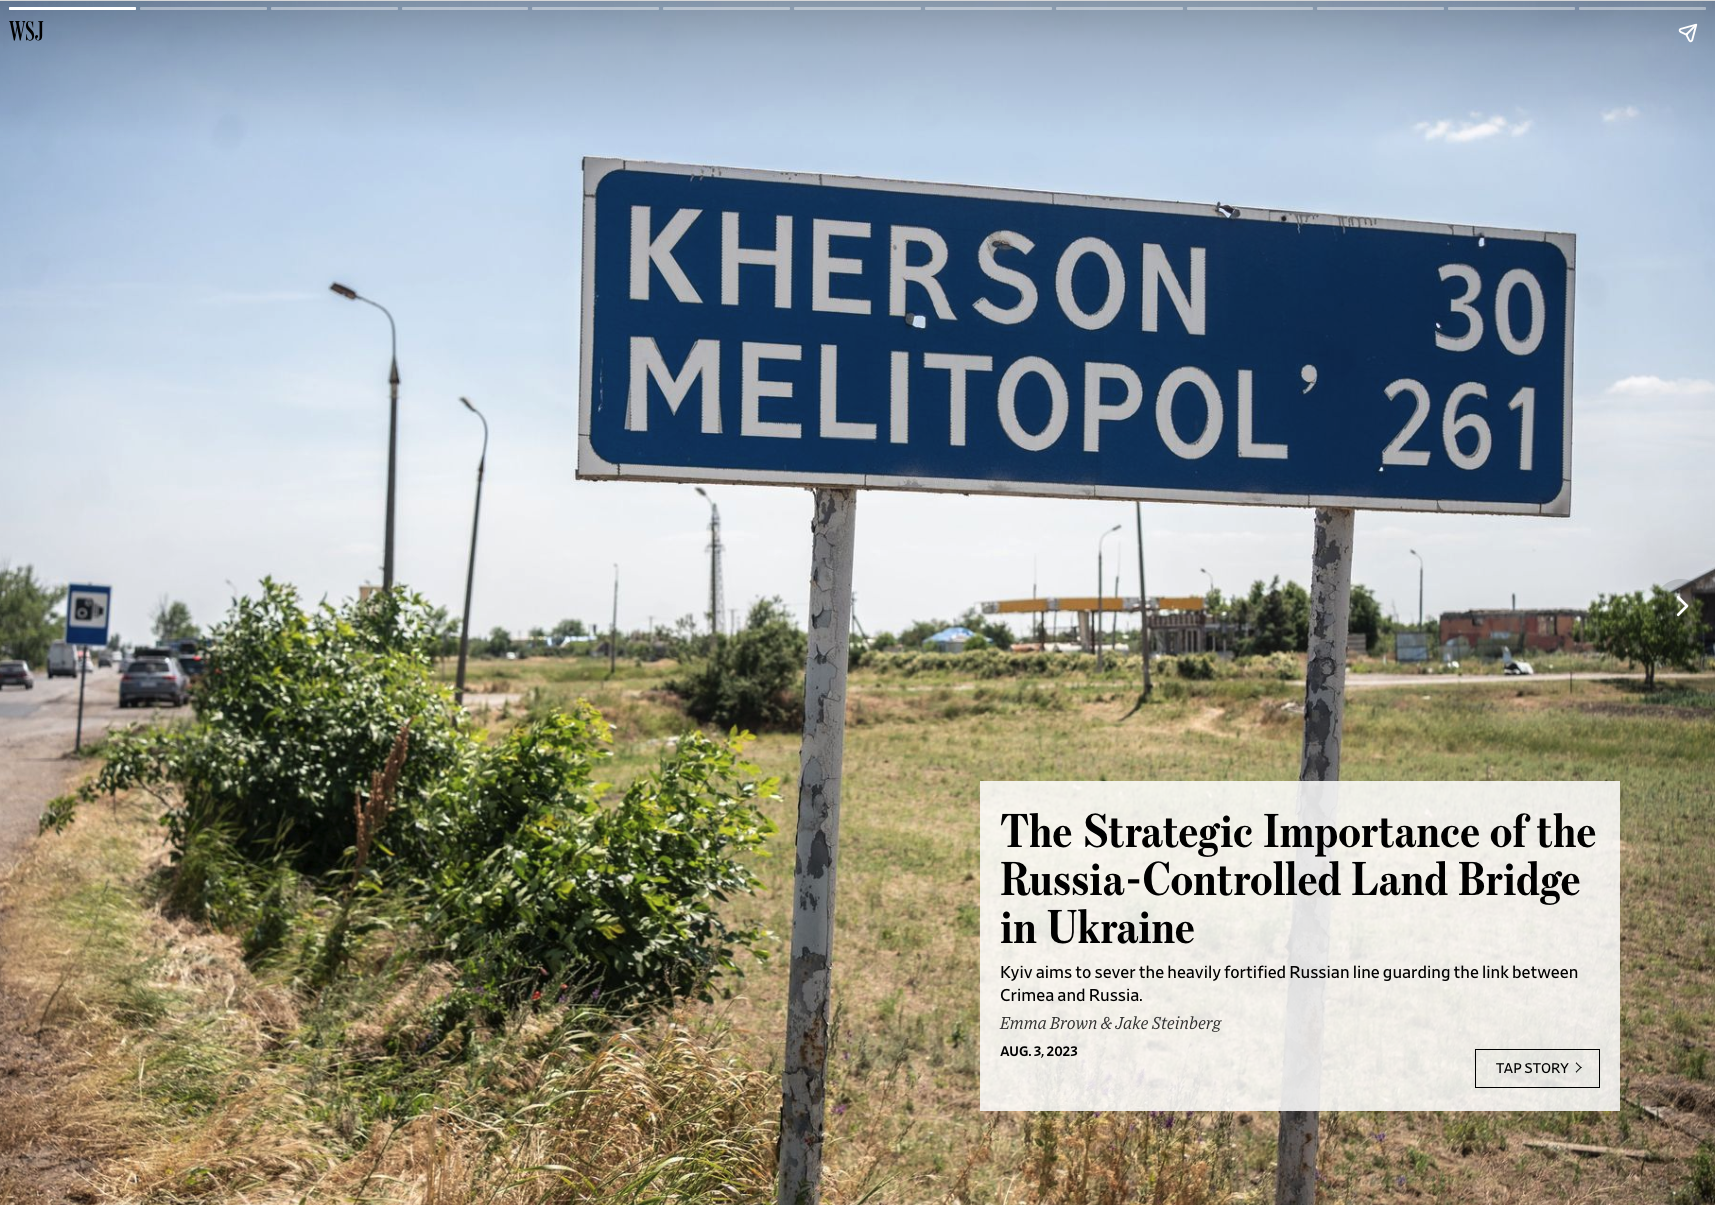
Live page: https://www.wsj.com/story/the-strategic-importance-of-the-russia-controlled-land-bridge-in-ukraine-832d0728
A map heavy tappable story about the so-called landbridge that connects Russia to Crimea by way of the Donbas.
Maps by Emma Brown & Jake Steinberg
Maps by Emma Brown & Jake Steinberg
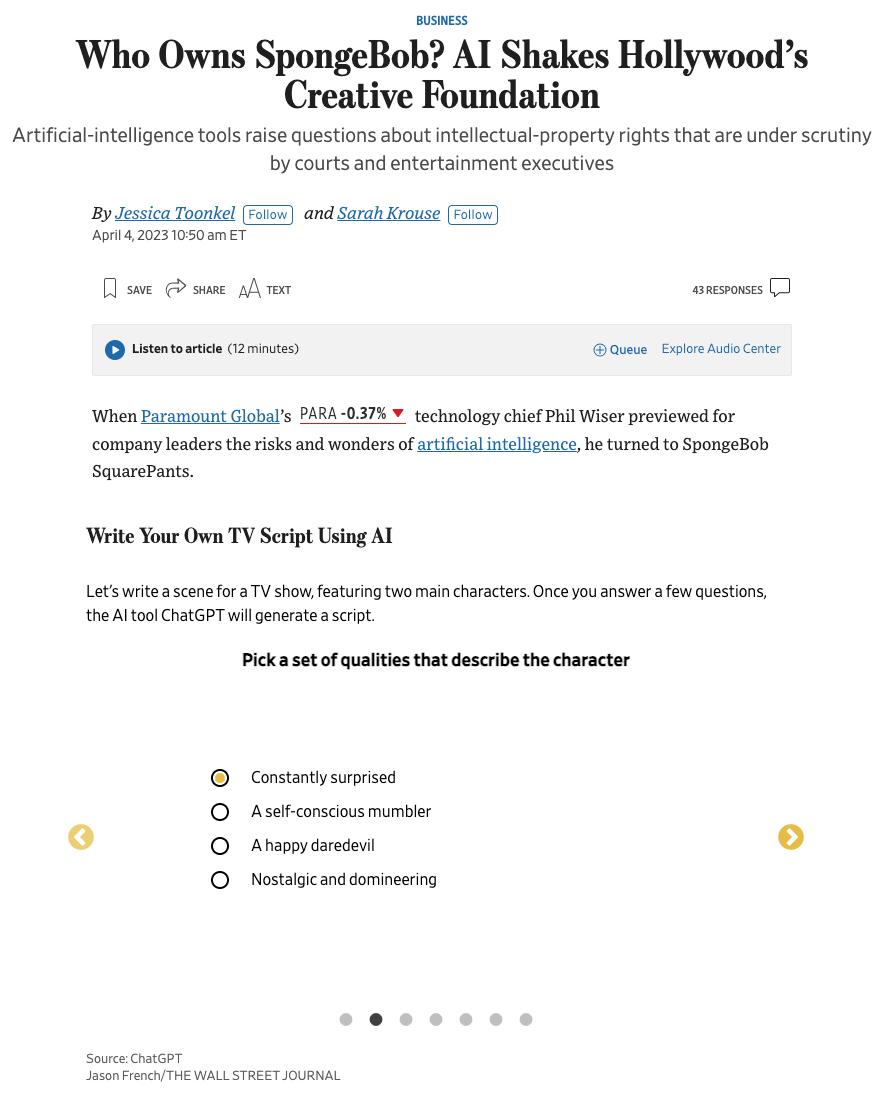
Live page: https://www.wsj.com/articles/ai-chatgpt-hollywood-intellectual-property-spongebob-81fd5d15
Contributed to this story by Jessica Toonkel and Sarah Krouse an interactive tool where ChatGPT creates (from predetermined options) a short movie script.
Coding/development by Jason French
Coding/development by Jason French

A standalone explainer the search for the Titan submersible.
Diagrams by Jemal R. Brinson, Kevin Hand and Andrew Mollica
Maps by Jake Steinberg and Carl Churchill
Diagrams by Jemal R. Brinson, Kevin Hand and Andrew Mollica
Maps by Jake Steinberg and Carl Churchill
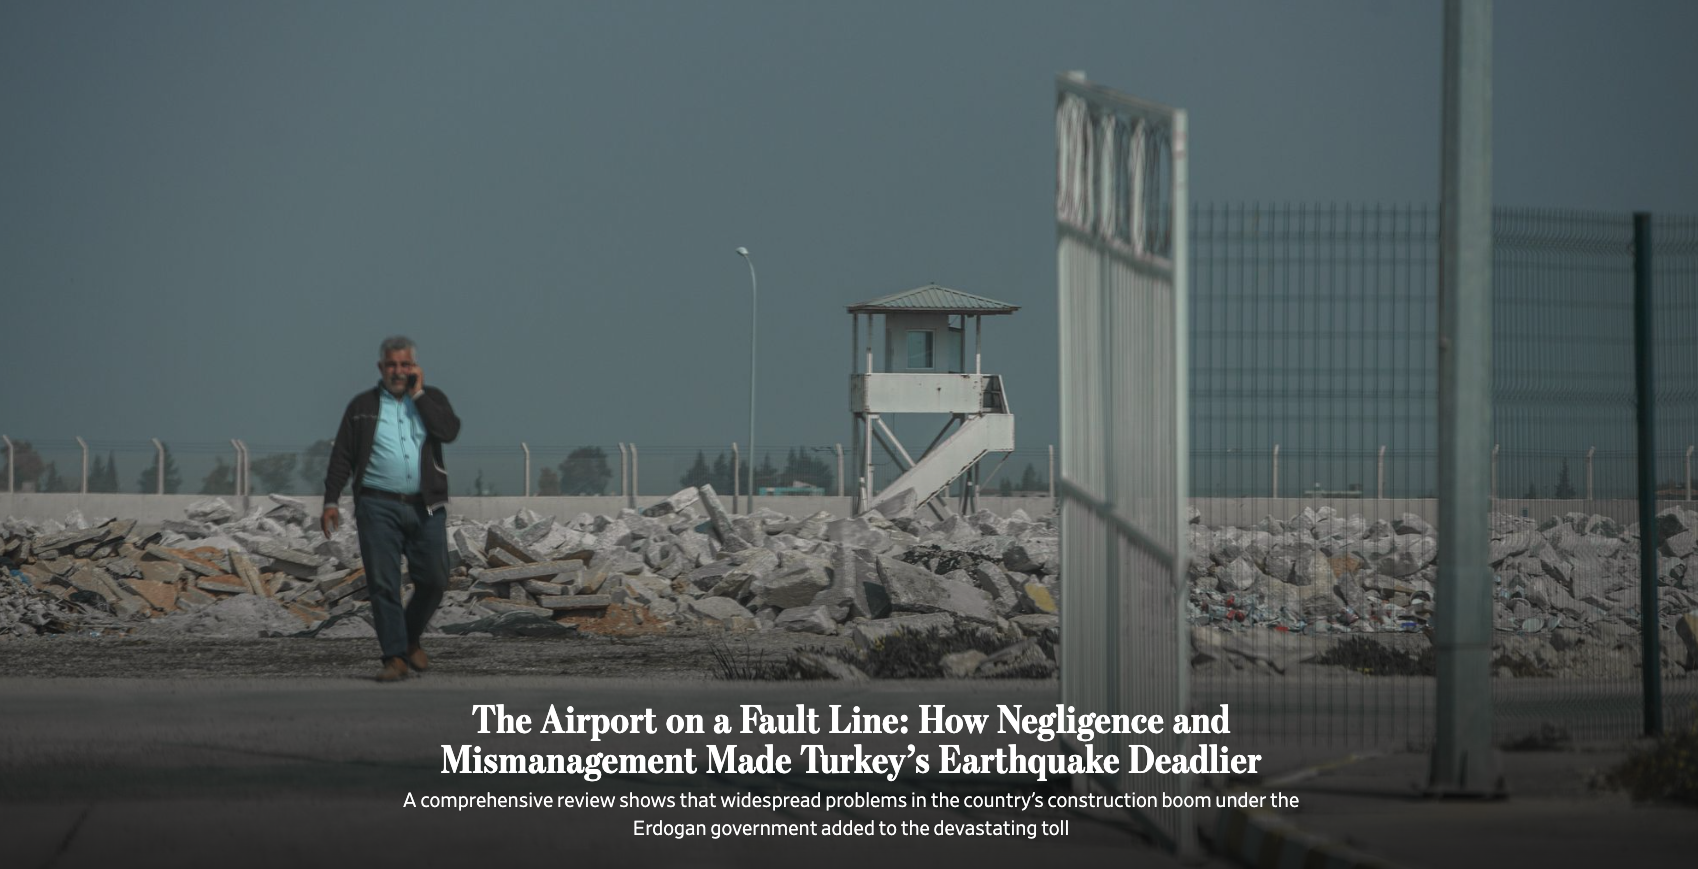
On this text story we contributed a scrolly satelllite image showing how the earthquake affected the emergency structure and a map showing the fault lines and the drained lake in Hatay province.
Production by Juanje Gómez
Map by Emma Brown
Production by Juanje Gómez
Map by Emma Brown